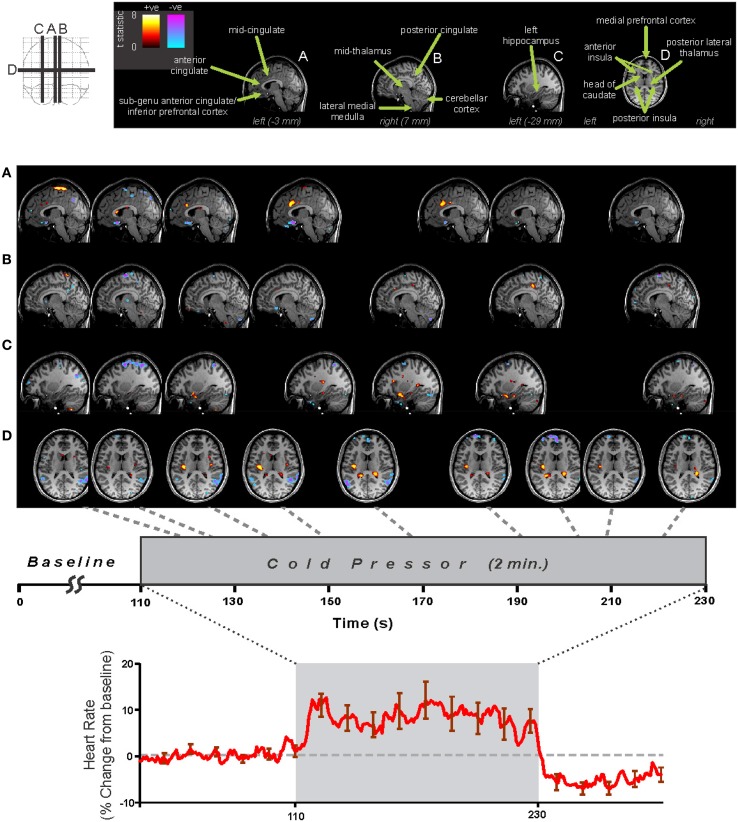
Figure 5.
Foot cold pressor fMRI and heart rate responses in 29 healthy adolescents (16 male, age mean ± sd [range] = 15.3 ± 2.4 [10.1–19.0] years, 4 left handed). Analysis using SPM software with timepoint-by-timepoint modeling of significant responses (each point p < 0.05 t-test, all regions corrected at whole-model F-test level for multiple comparisons at p < 0.05 family-wise error). Heart rate calculated from pulse-oximetry signal. Regions of signal increases (warm colors) and decreases (cold colors) are overlaid on three sagittal (A–C) and one axial (D) slices at selected time-points during challenge (Data from Valladares et al., 2006).

