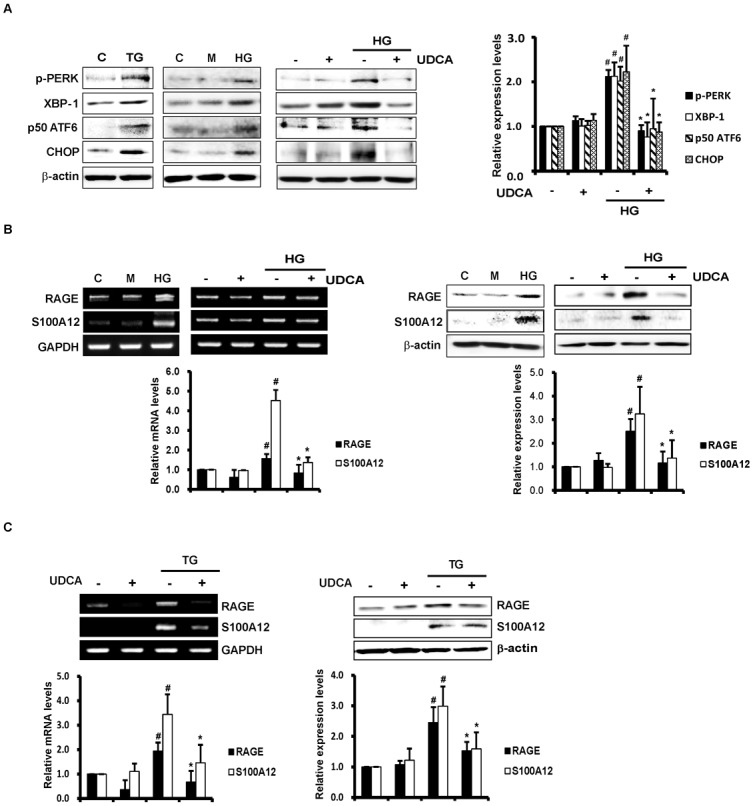
Fig 1. Effects of UDCA on ER stress and expression of RAGE and the ligand thereof.

Cells were incubated with HG (30 mM) or mannitol (M; 30 mM, osmotic control) for varying periods after pretreatment with UDCA (100 μM) for 2 h. (A) The expression levels of ER stress markers including phospho-PERK, XBP-1, p50 ATF6, and CHOP were measured by Western blotting. Thapsigargin (TG, 2 μM) was used as a positive control (triggering ER stress). #,* Significant difference at the P < 0.025 based on post-hoc Mann-Whitney U test following a Kruskal-Wallis test (#, Control vs. HG; *, HG vs. HG + UDCA). Error bars: SEMs. (B and C) The levels of mRNAs encoding RAGE and the ligand thereof, and the protein levels per se, were detected by RT-PCR and Western blotting, respectively. RNA was extracted from cells after 8 h of HG or TG treatment. RT-PCR using primers amplifying RAGE, S100A12, and GAPDH (internal control) was performed as described in Methods and Materials. Total proteins were prepared from cell lysates after 24 h of HG (B) or TG (C) exposure. Representative images from at least three experiments are shown. #,* Significant difference at the P < 0.025 based on post-hoc Mann-Whitney U test following a Kruskal-Wallis test (#, Control vs. HG/TG; *, HG/TG vs. HG/TG + UDCA). Error bars: SEMs.
