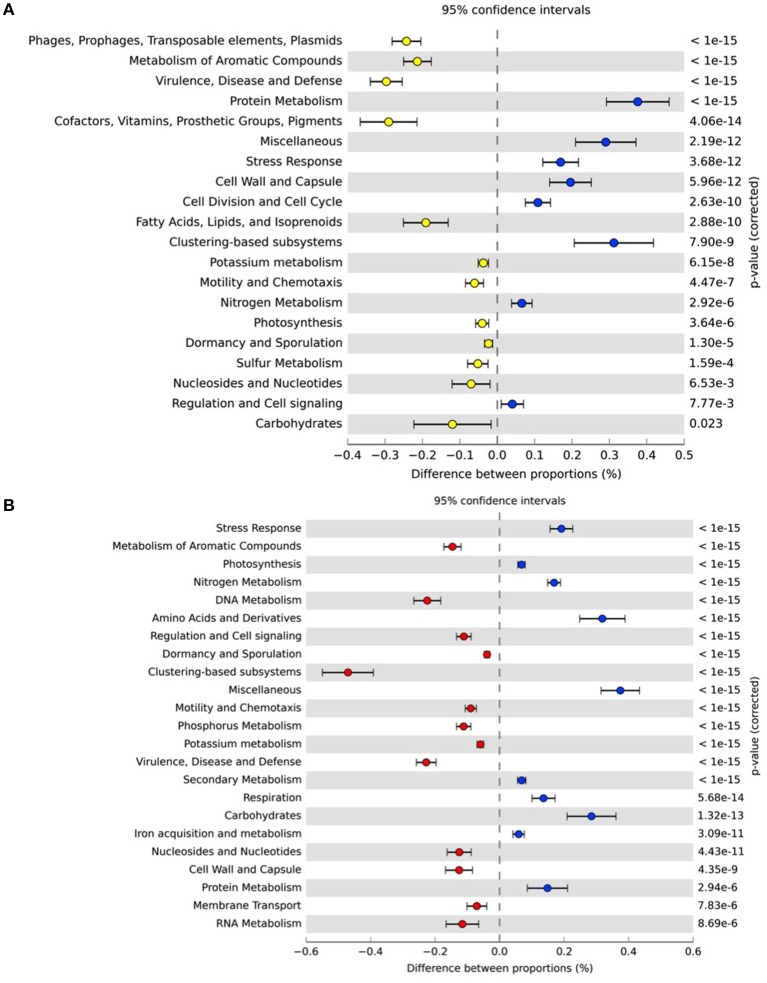
Figure 8.
Pairwise comparison of functional profiles between Sydney Heads (PJ7, blue circles, positive differences between proportions on right-hand side of plot) and (A) Blackwattle Bay (PJ3; yellow circles) (B) Homebush Bay (P3; red circles). Corrected p-value is determined using Fisher's exact test with a Benjamini FDR multiple test correction. Pathways are level one of SEED metabolic hierarchy.

