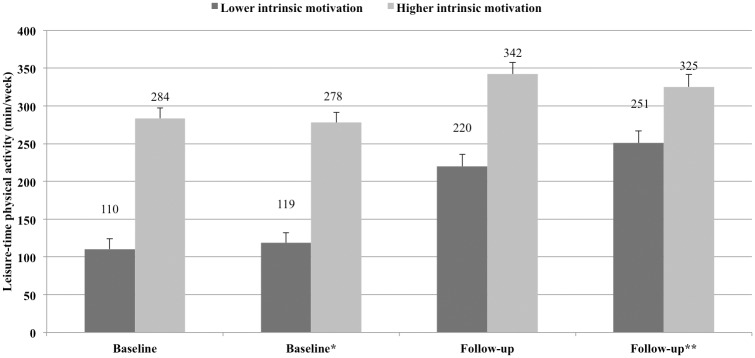
Fig 2. Associations between intrinsic motivation and leisure-time physical activity at baseline and at follow-up (between-group comparisons of estimated marginal means with linearly independent pairwise tests: baseline—mean dif. = -173 min/week, 99% CI = -223, -124; baseline*—mean dif. = -159 min/week, 99% CI = -209, -110; follow-up—mean dif. = -122 min/week, 99% CI = -175, -69; follow-up**—mean dif. = -74 min/week, 99% CI = -131, -18).
Note: Groups represent the lowest and highest tertile-split groups of adjusted intrinsic motivation means at baseline. At baseline, adjustments were made for highest education level, number of dependent children, employment status, personal income, household income and neighborhood “walking environment” (*and weight control intentions); at follow-up, adjustments were made for number of dependent children, employment status and personal income (**and leisure-time physical activity at baseline and weight control intentions). Error bars indicate the standard error of the mean.

