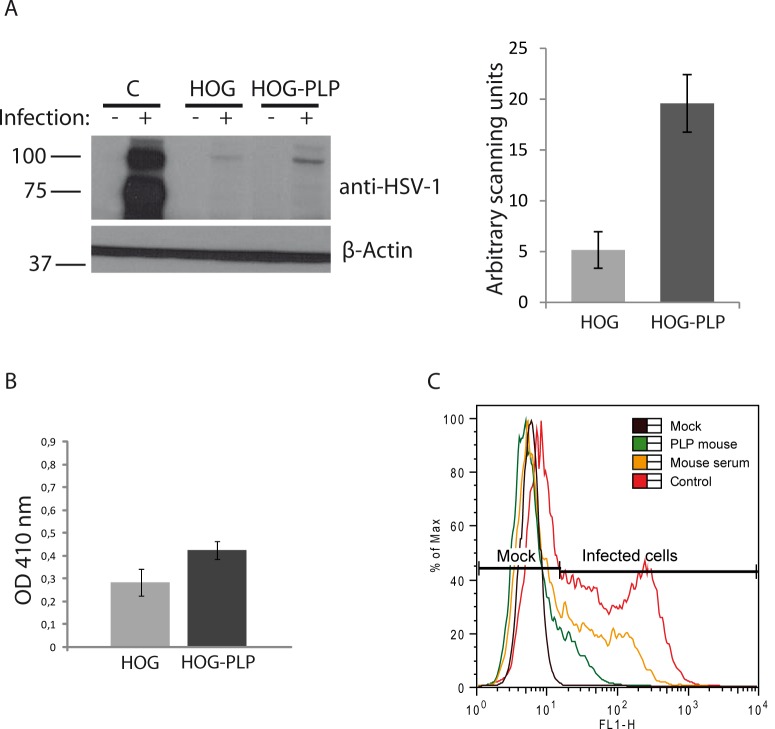
Fig 3. Viral entry assays.
A. HOG and HOG-PLP cells were infected with R120vGF at a m.o.i. of 1. After 24 h p.i., equal number of cells were subjected to SDS–PAGE and analyzed by immunoblotting with a rabbit polyclonal anti-HSV-1 antibody to detect immediate early proteins. In HOG-PLP cells, an increase in viral signal was observed. A positive control of HOG cells infected with HSV-1 was also included. The histogram corresponds to the quantification of the immunoblot signals expressed in arbitrary scanning units. B. Confluent monolayers of cells plated in 96-well tissue culture dishes were infected with a recombinant HSV-1 (KOS) gL86 at a m.o.i. of 10. After 6 h p.i., the β-galactosidase activity at 410 nm was analyzed in a microplate reader. Optical density (OD) was increased in HOG-PLP cells compared to HOG cells. C. To perform an antibody blocking assay, HOG cells blocked with an anti-PLP antibody were infected at a m.o.i. of 1 with K26GFP and processed for flow cytometry, analyzing fluorescence of GFP. Percentage (%) of max designates the number of cells relative to the maximum fraction. For each fluorescence intensity within positive cells, the percentage of cells incubated with blocking mouse anti-PLP antibody is considerably lower than control cells incubated without blocking antibodies (red plot) or cells incubated with a control mouse serum (yellow plot). Data are representative of 3 independent experiments.

