Figure 3.
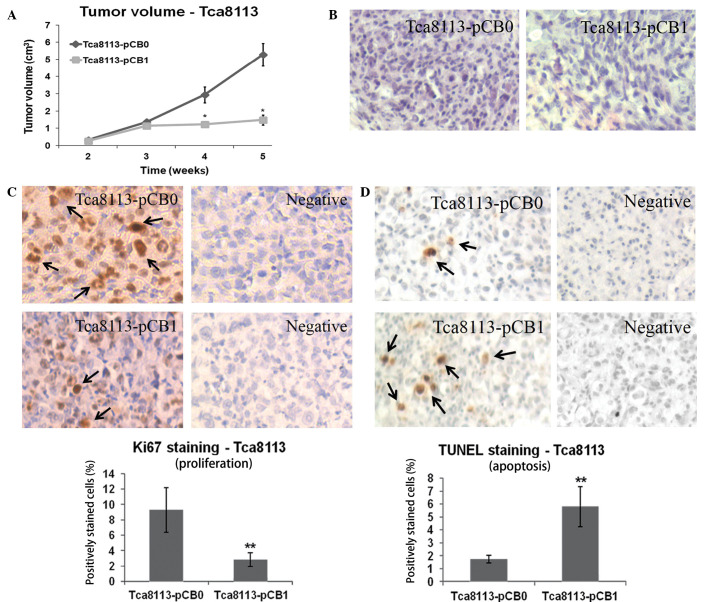
Expression of the mfat-1 gene reduces subcutaneous tumor growth of Tca8113 cells. (A) Tumor volume in the mice implanted with mfat-1-transfected Tca8113 cells and the control. *P<0.05. vs. pCB0. (B) Hematoxylin and eosin staining. (C) mfat-1 gene expression inhibited proliferation of the tumor. Quantified data were determined by the number of Ki-67-positive cells divided by the total number of cells in five randomly selected fields under light microscopy (×400). **P<0.001 vs. pCB0. (D) mfat-1 gene expression led to increased apoptosis in tumor cells. Similar sections were stained by TUNEL. Black arrows indicate Ki-67-positive nuclei. Quantified data were determined by the number of apoptotic nuclei divided by the total number of cells in five randomly selected fields under light microscopy (×400). **P<0.001 vs. pCB0. pCB0, control expression vector; pCB1, fat-1 gene expression vector.

