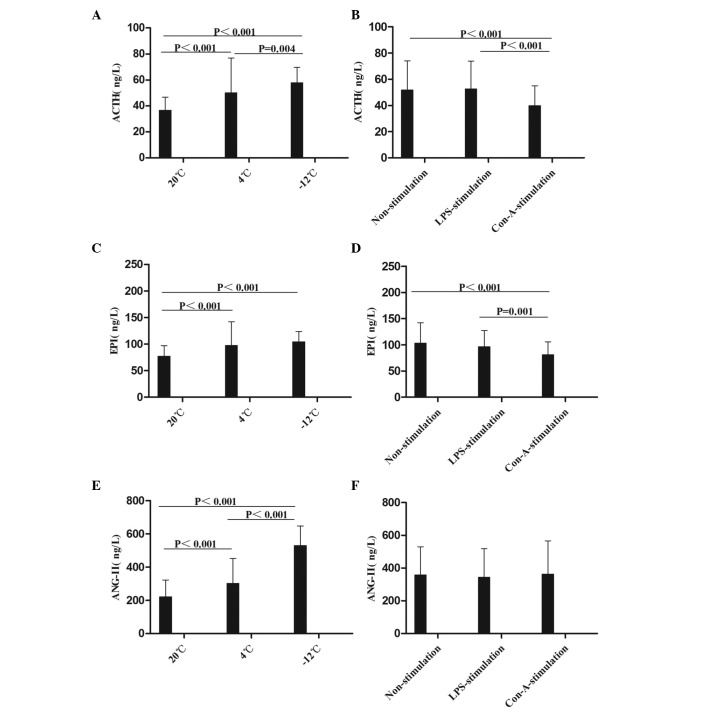
Figure 1.
Comparison of the mean levels of (A and B) ACTH, (C and D) EPI and (E and F) ANG-II in the plasma at different temperatures and with different stimulants. Data are presented in ng/l as the mean ± standard deviation. (A and B) Analysis of the ACTH data revealed the following: Comparison among multiple temperatures, F (2,230)=28.714, P<0.001; comparison among multiple stimulants, F (2,230)=10.864, P<0.001; comparison between temperatures and stimulants, F (4,230)=6.652, P<0.001. (C and D) Analysis of the EPI data revealed the following: Comparison among multiple temperatures, F (2,215)=20.685, P<0.001; comparison among multiple stimulants, F (2,215)=8.663, P<0.001; comparison between temperatures and stimulants, F (4,215)=6.195, P<0.001. (E and F) Analysis of the ANG-II data revealed the following: Comparison among multiple temperatures, F (2,213)=150.164, P<0.001; comparison between temperatures and stimulants: F (4,213)=5.971, P<0.001. ACTH, adrenocorticotropin; EPI, epinephrine; ANG-II, angiotensin-II; LPS, lipopolysaccharide; Con-A, concanavalin A.

