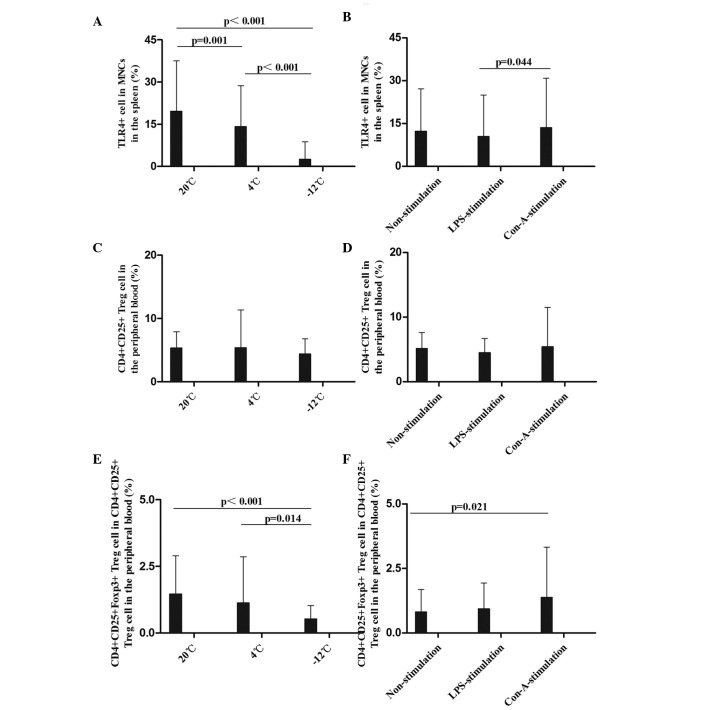
Figure 5.
Comparison of the mean levels of (A and B) TLR4+ MNCs in the spleen, (C and D) CD4+CD25+ Treg cells and (E and F) CD4+CD25+Foxp3+ Treg cells in the peripheral blood at different temperatures and with different stimulants. Data (%) are presented as the mean ± standard deviation. (A and B) Analysis of the TLR4+ MNC data revealed the following: Comparison among multiple temperatures, F (2,108)=67.199, P<0.001; comparison among multiple stimulants, F (2,108)=2.129, P=0.126; LPS vs. Con-A, P=0.044. (C and D) Analysis of the CD4+CD25+ Treg cell data revealed the following: Comparison among multiple temperatures, F (2,108)=0.754, P=0.474; comparison among multiple stimulants, F (2,108)=0.532, P=0.589. (E and F) Analysis of the CD4+CD25+Foxp3+ Treg cell data revealed the following: Comparison among multiple temperatures, F (2,108)=7.984, P=0.001; comparison between temperatures and stimulants, F (4,108)=1.907, P=0.118; comparison between 20°C and −12°C, P<0.001; comparison between 4°C and −12°C, P=0.014. TLR, Toll-like receptor 4; CD, cluster of differentiation; Foxp3, Forkhead box P3; MNC, mononuclear cell; Treg, regulatory T; LPS, lipopolysaccharide; Con-A, concanavalin A.

