
Figure 7.
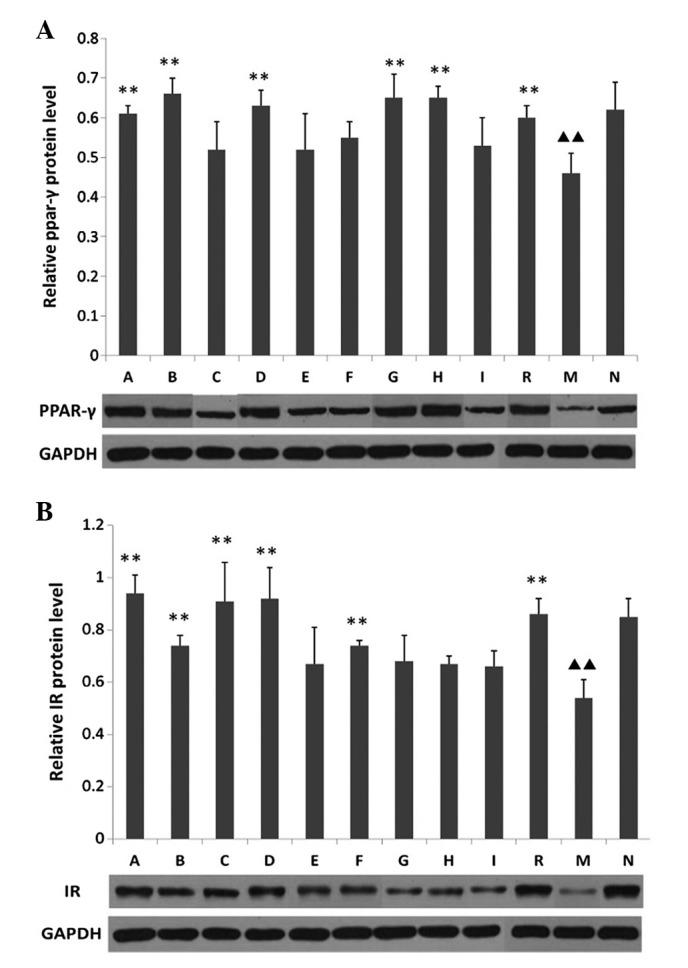
Western blot analysis of (A) PPAR-γ and (B) IR protein expression. GAPDH was used as a loading control. Data are presented as the mean ± standard deviation. ▲▲P<0.01 vs. the control group; **P<0.01 vs. the model group. PPAR-γ, proliferator-activated receptor-γ; IR, insulin receptor; A-I, orthogonal experiment groups A-I; R, rosiglitazone treatment group; M, model group; N, control group.