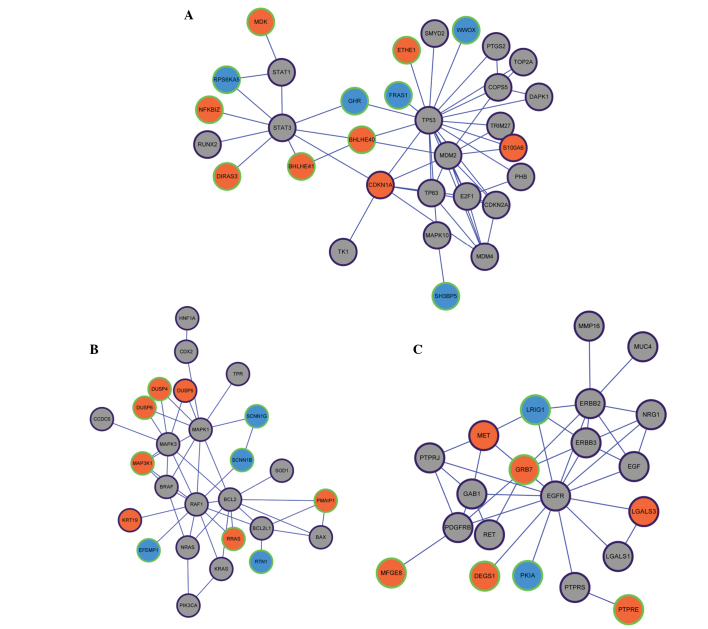
Figure 1.
Selected modules from the protein-protein interaction network: (A) Module 1, (B) module 2 and (C) module 3. Orange and blue nodes represent products of up- and downregulated DEGs, respectively. Grey nodes represent PTC-associated genes that were not included in the DEGs. Nodes with a purple edge represent PTC-associated genes that were collected in the Malacard database. Nodes with a green edge represent PTC-associated genes that were not collected in the Malacard database. DEG, differentially-expressed gene; PTC, papillary thyroid carcinoma.

