
Figure 1.
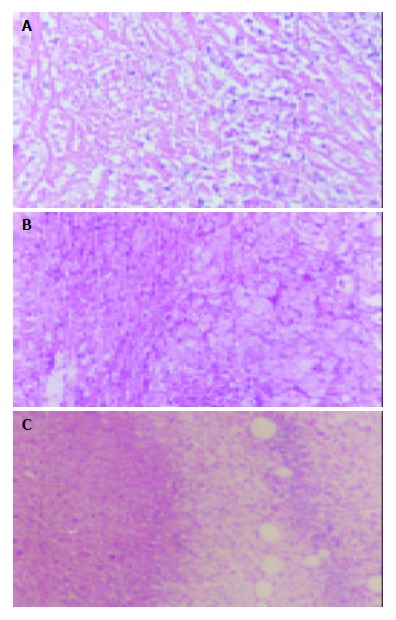
Pathological changes of tumor tissues 7 d after TAE. A: Control group showing spotty and scattered necrosis. B: LP group showing many patched necrotic zones. C: LP+ODNs group showing big areas of central necrosis. Hematoxylin-eosin ×40.
Official websites use .gov
A
.gov website belongs to an official
government organization in the United States.
Secure .gov websites use HTTPS
A lock (
) or https:// means you've safely
connected to the .gov website. Share sensitive
information only on official, secure websites.
Pathological changes of tumor tissues 7 d after TAE. A: Control group showing spotty and scattered necrosis. B: LP group showing many patched necrotic zones. C: LP+ODNs group showing big areas of central necrosis. Hematoxylin-eosin ×40.