
Figure 6.
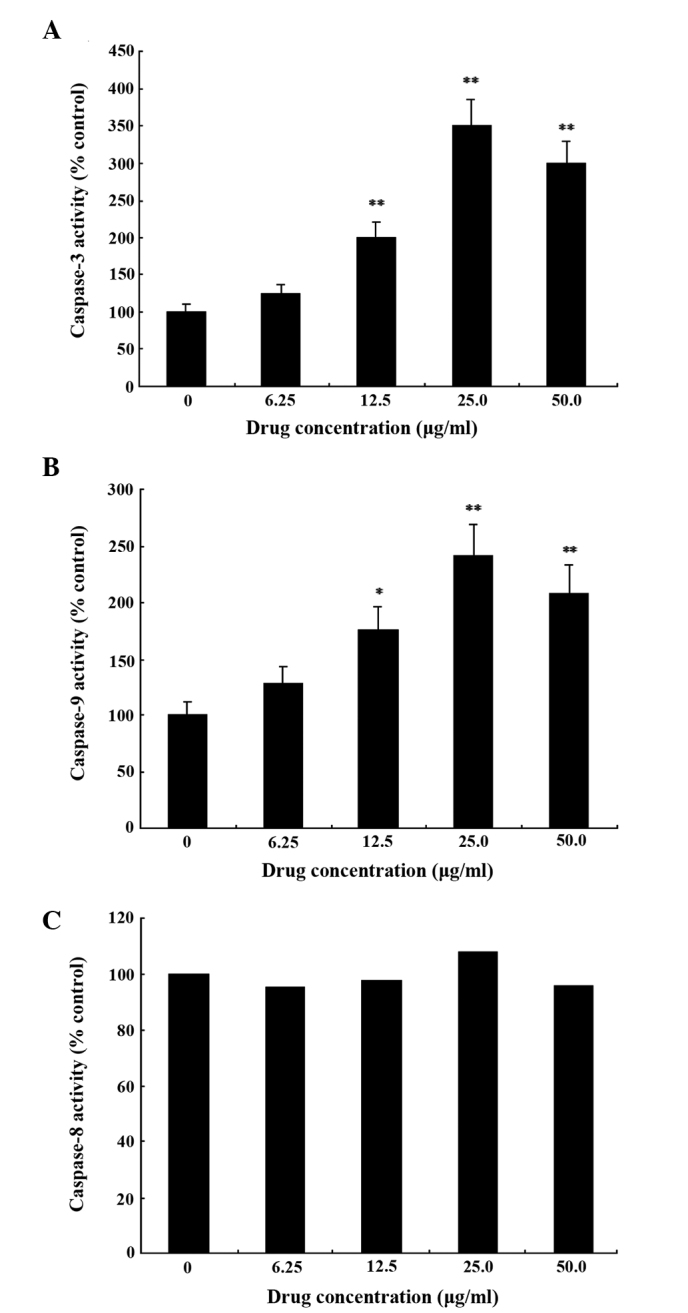
Detection of the activity of (A) caspase-3, (B) caspase-9 and (C) caspase-8 in SMMC-7721 cells following treatment with various concentrations of gallic acid for 48 h. Data are expressed as the mean ± standard deviation of three independent experiments. *P<0.05, **P<0.01, vs. control group.