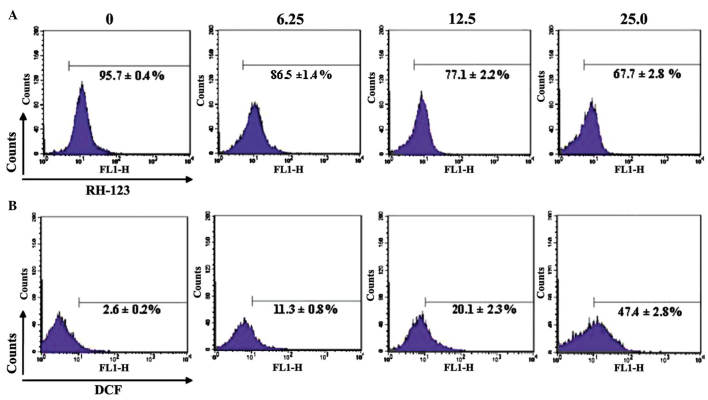
Figure 7.
Flow cytometric analysis of SMMC-7721 cells following treatment with various concentrations of GA. (A) Mitochondrial membrane potential and (B) the generation of ROS in SMMC-7721 cells following treatment with various concentrations of GA. Data are expressed as the mean ± standard deviation. RH-123, rhodamine 123; DCF, 2,7-dichlorfluorescein; ROS, reactive oxygen species; GA, gallic acid.

