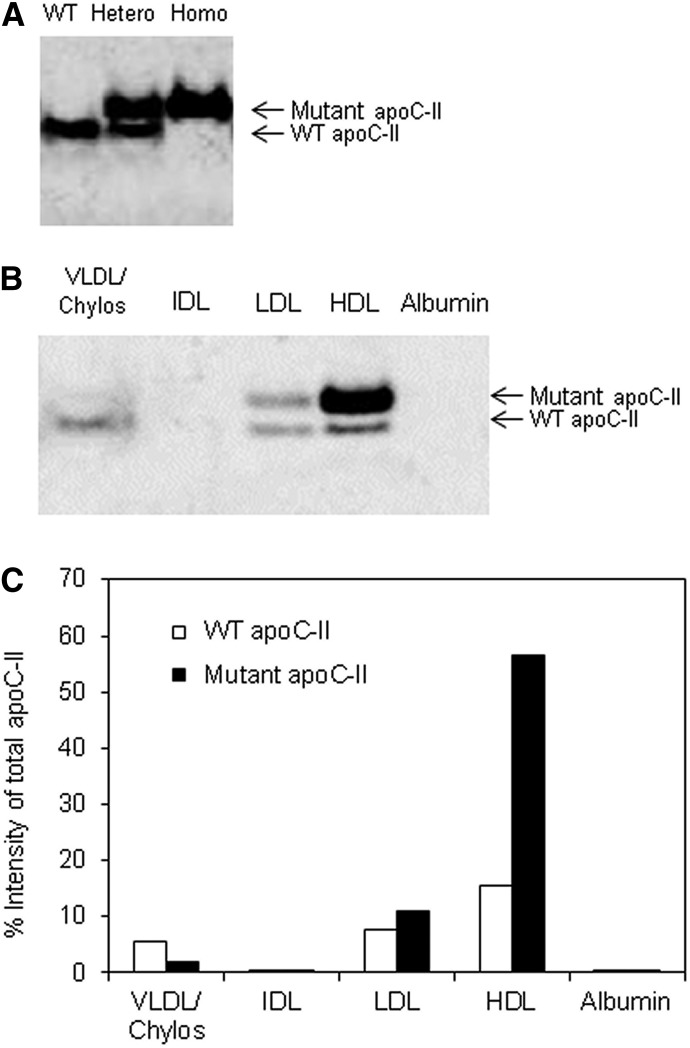
Fig. 2.
WT and mutant apoC-II protein abundance and size. (A) Immunoblotting of apoC-II from plasma of three representative individual mice (WT, heterozygous, and homozygous mice). (B) Immunoblotting of apoC-II from FPLC fractions [VLDL/chylos (20 μl), IDL (20 μl), LDL (7 μl), HDL (7 μl), and albumin (20 μl)] of an apoC-II heterozygous mouse. (C) Quantitation of WT versus mutant apoC-II in FPLC fractions [from (B)] by densitometry, expressed as a percentage of the total signal (WT plus mutant) for apoC-II in all fractions combined. The percentages were corrected for the different volumes applied to the gel.

