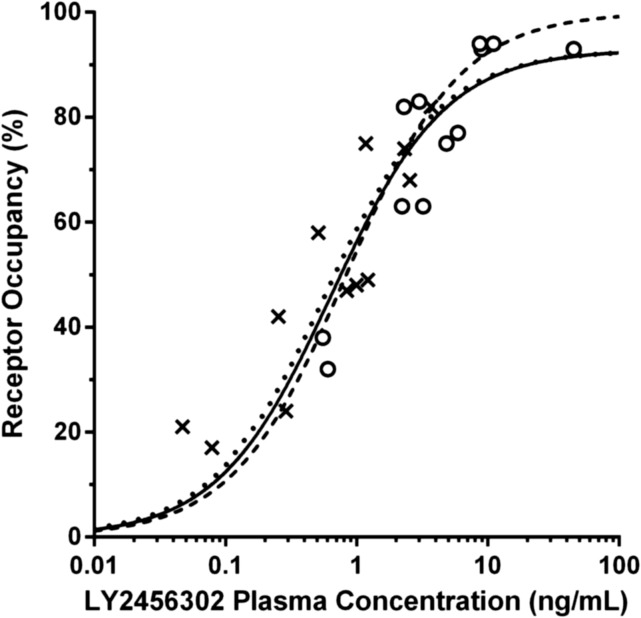
Fig. 6.
Relationship between predicted LY2456302 plasma concentration and KOR occupancy. Three fits are shown: two-parameter (rmax and IC50) NLME model (dotted curve), two-parameter NLLS model (solid curve), and one-parameter (IC50, rmax = 100%) NLLS model (break curve). Plasma concentrations at the time of each postdose scan were calculated from a PK model applied to the observed PK data. Occupancies at 2.5 hours and 24 hours postdose are shown in circles and crosses, respectively.

