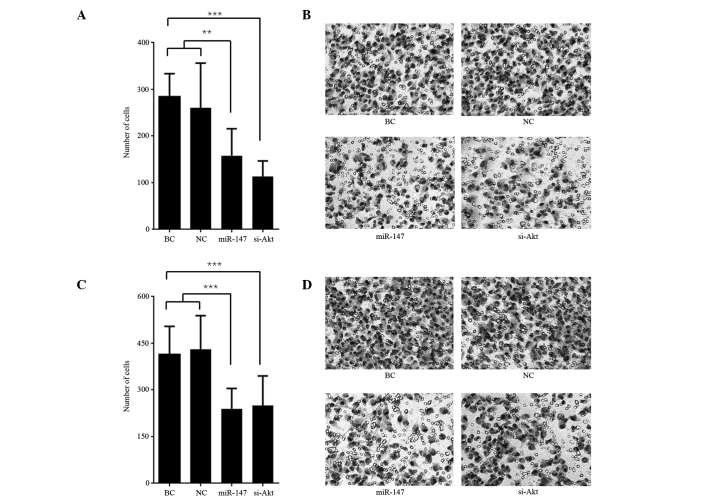
Figure 3.
miR-147 repressed cell invasion and migration. (A) Number of cells that invaded the Matrigel and membrane. **P<0.01 vs. BC and NC; ***P<0.001 vs. BC. (B) Typical images of the invasion assay, at ×400 magnification. (C) Number of cells that traversed the membrane. ***P<0.001 vs. BC and NC; ***P<0.001 vs. BC. (D) Typical images of the migration assay, at ×400 magnification. BC, blank control cells; NC, normal control cells; miR-147, miR-147 mimics-transfected cells; si-Akt, specific siRNA knockdown of Akt.

