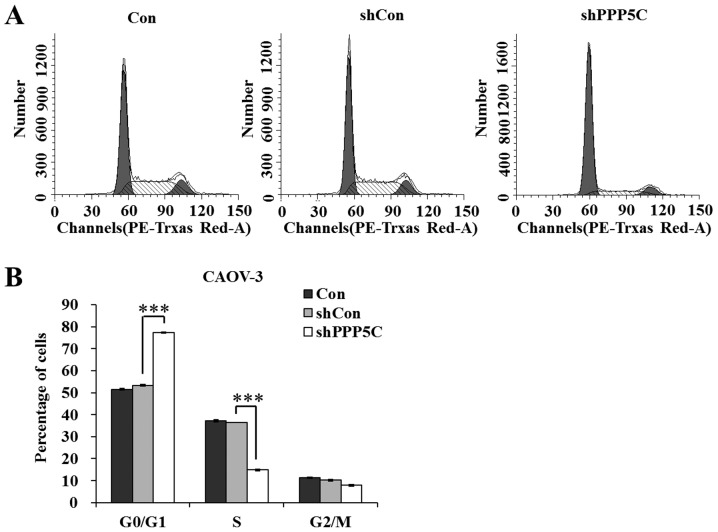
Figure 3.
Effect of protein phosphatase 5 (PP5) knockdown on cell cycle of CAOV-3 cells. (A) Flow cytometric analysis of cell cycle. Representative images are from one of three independent experiments. (B) Statistical analysis of G0/G1-phase, S-phase and G2/M-phase populations in non-treated cells (Con), and cells treated with lentiviruses containing non-silencing shRNA (shCon) and PP5 shRNA (shPPP5C). Data are presented as the means ± standard deviation of three independent experiments performed in triplicate. ***P<0.001 vs. shCon.

