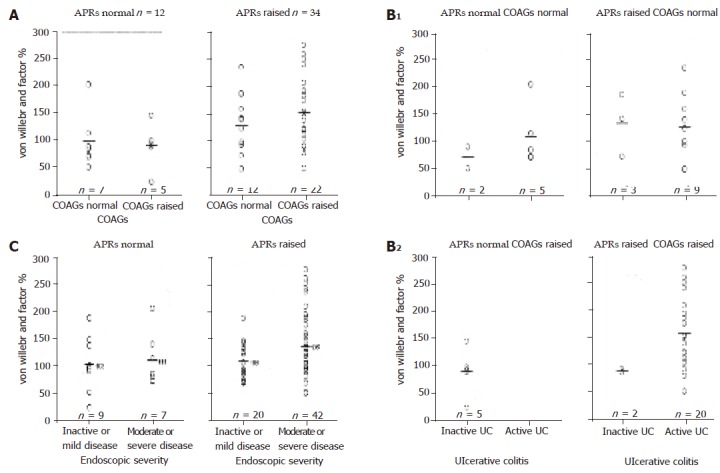
Figure 1.

Mean plasma von Willebrand factor (vWF) levels in UC patients (A), their subgroups were divided according to disease activity, APRs and COAGs (B1, B2), as well as according to endoscopic severity and APRs(C). Open circle black dots (o) represent individual values and horizontal black lines (-) represent mean values. APRs: acute-phase reactants; COAGs: thrombin generation coagulation markers.
