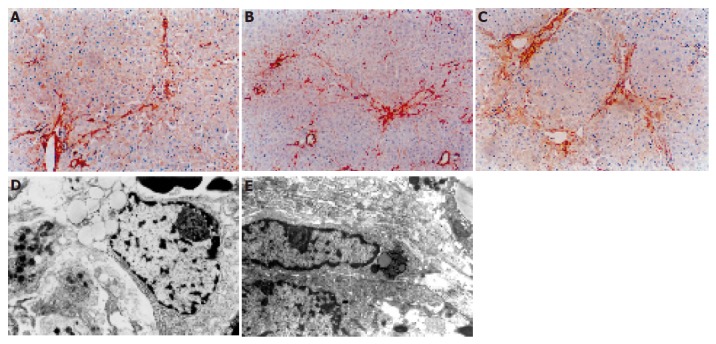
Figure 4.

Distribution of α-SMA positive cells after DMN treatment. A: After 14 d, linear immunoreaction for α-SMA was scattered along the sinusoidal wall; B: after 21 d, a network of α-SMA cells was evident; C: after 28 d, a dense network of α-SMA cells was evident; D: after 14 d, transitional hepatic stellate cells were observed under electron microscope; E: after 21 or 28 d, typical myofibroblasts were embedded in the core of fibrous septa.
