
Figure 6.
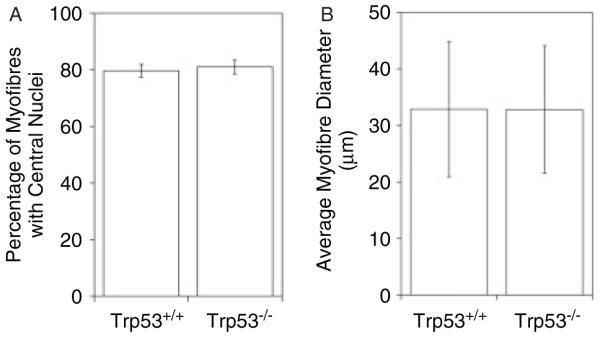
Quantification of muscle regeneration in cardiotoxin (Ctx)-treated Trp53+/+ and Trp53−/− muscle. Trp53+/+ and Trp53−/− mice were similarly treated with weekly injections of cardiotoxin (Ctx). Two weeks prior to analysis, Ctx injections were stopped and muscles were allowed to regenerate. The percentage of myofibres with centrally located myofibre nuclei, an indicator of at least one cycle of muscle degeneration and regeneration, was quantified (A), as was the average myofibre diameter (B). Errors are standard deviations for n = 4 animals per condition.