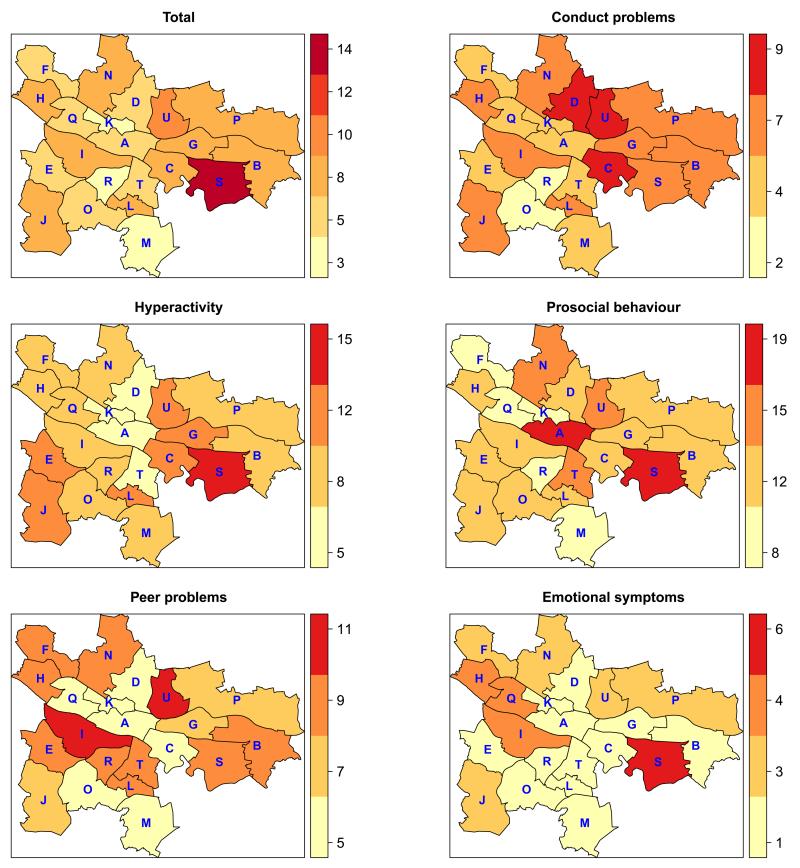
Figure 2.
Map of Glasgow City split into electoral wards, with the colours representing the percentage of children living in each ward who had ‘abnormal’ Strengths and Difficulties Questionnaires (SDQ) score (total e16; conduct problems e4, hyperactivity e7, prosocial behaviour d4, peer problems e5, emotional symptoms e6). A, Anderston/City; B, Baillieston; C, Calton; D, Canal; E, Craigton; F, Drumchapel/Anniesland; G, East Centre; H, Garscadden/Scotstounhill; I, Govan; J, Greater Pollok; L, Langside; M, Linn; N, Maryhill/Kelvin; O, Newlands/Auldburn; P, North East; Q, Partick West; R, Pollokshields; S, Shettleston; T, Southside Central; U, Springburn.

