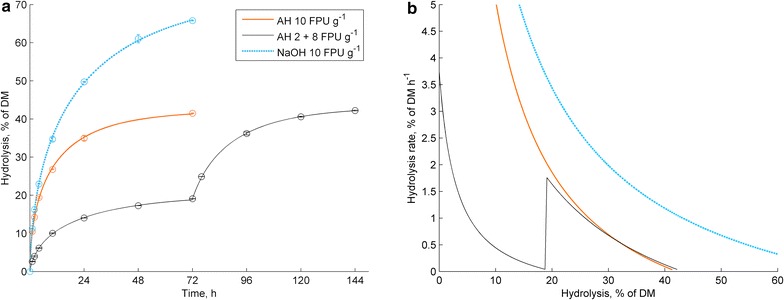
Fig. 1.

Hydrolysis time curves (a) and hydroysis rates as the function of hydrolysis degree (b) for 10 FPU g−1 enzyme dosage with NaOH-straw (blue-dotted line), AH-straw (red solid line) and the stepwise reaction with AH-straw with initial 2 FPU g−1 for 72 h, a subsequent addition of 8 FPU g−1 and continued incubation for another 72 h (black line). Error bars represent the standard deviation of duplicate hydrolysis reactions
