
Fig. 2.
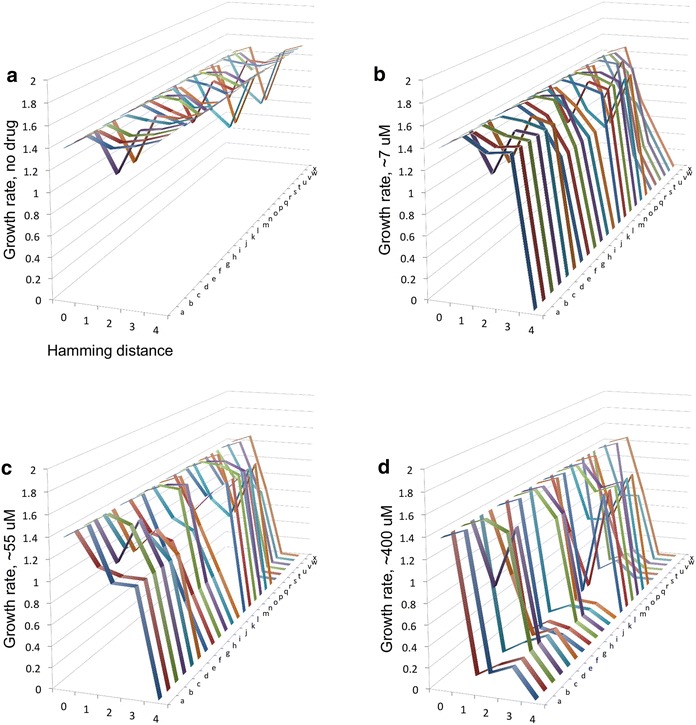
The structure of reverse evolution trajectories in Plasmodium vivax. Twenty-four adaptive landscapes for P. vivax DHFR across several drug concentrations, organized into individual trajectories. The y-axis is growth rate. The x-axis denotes hamming distance from the original, which is the quadruple mutant (1111) in this study (0 = quadruple mutant, 1 triple mutant, 2 double mutant, 3 singe mutant, 4 ancestral allele), and the z-axis corresponds to the 24 different possible pathways between the most resistant allele (1111) and the ancestral allele (0000). Additional file 6 identifies the individual pathways a–x. Growth rates are in units of time−1. Concentrations: a no drug, b ~7 μM, c ~55 μM, d ~400 μM