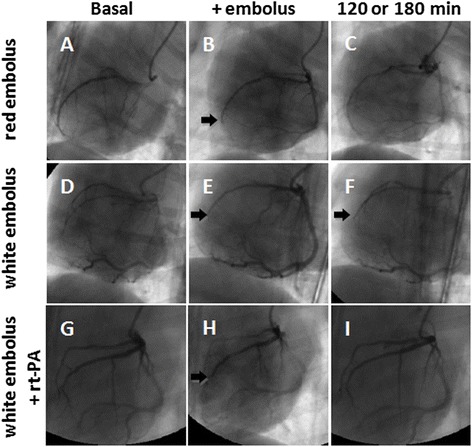
Fig. 2.

Coronary embolism changes at different time points were revealed by coronary angiography. The up-panel images represented respectively: before (a), 60 min (b) or 120 min (c) after occlusion with red embolus; mid-panel images represented respectively before (d), 60 min (e) or 180 min (f) after occlusion with white embolus; bottom-panel images represented respectively before occlusion (g) by white embolus in the rt-PA group; 60 min after injection of the white embolus (h) and 120 min after rt-PA treatment (i). Arrows in (b), (e), (f) and (h) indicate the location of embolus
