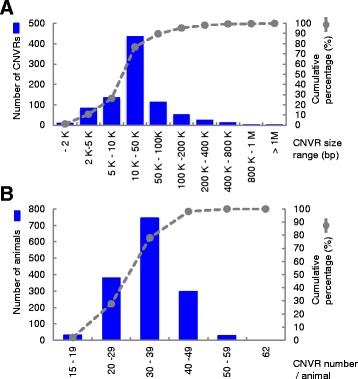
Fig. 2.

CNVR size distribution and CNVR number per animals. a The bar (blue) represents the CNVR size distribution in each size range; the line plot (gray) represents the cumulative percentage of CNVR number. b The bar (blue) represents the CNVR number per animal; the line plot (gray) represents the cumulative percentage of CNVR number
