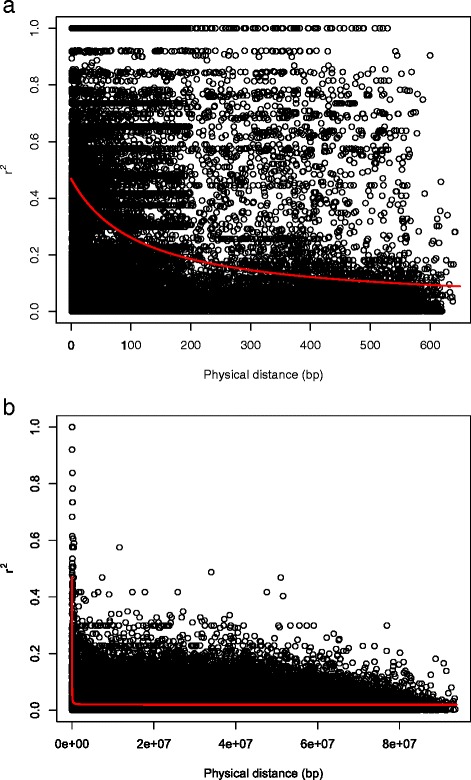
Fig. 2.

Nonlinear regression of the linkage disequilibrium measure r 2 against physical distance (bp) (a) based on the 790 original SNPs of the 51 parental inbreds and (b) based on 10,000 simulated SNPs of the simulated 51 parental inbreds. The red line is the nonlinear regression trend line of r 2 vs. physical distance
