
Fig. 3.
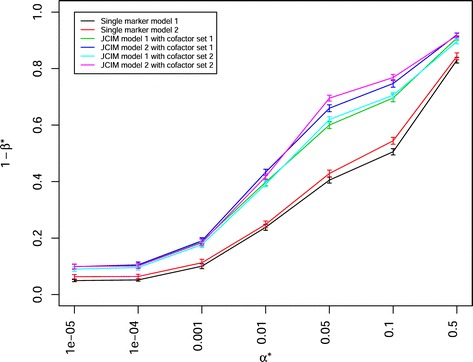
Power of QTL detection 1−β ∗ of four statistical models combined with two cofactor selection methods at different α ∗ levels in a scenario with 50 QTLs, heritability h 2= 0.8, and 40 backcross nested association mapping (BC-NAM) subpopulations which were randomly selected from a total of 50 BC-NAM subpopulations. JCIM represents joint composite interval mapping. Colors indicate different statistical models. Vertical lines at each point indicate the standard errors