
Fig. 8.
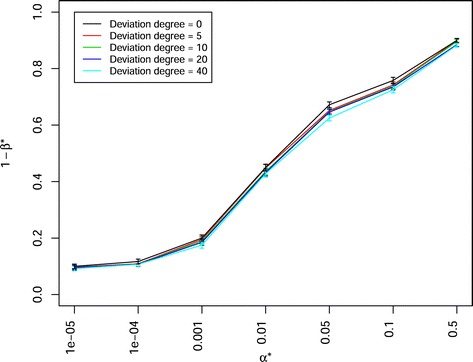
Power of QTL detection 1- β ∗ of joint composite interval mapping model 1 with cofactor selection method 1 for varied sample sizes of subpopulations with a standared deviation from 0 to 40 at different α ∗ levels in a scenario with 50 QTLs, heritability h 2=0.8, and 50 backcross nested association mapping (BC-NAM) subpopulations. Colors indicate different standard deviations for generating varied sample sizes of subpopulations. Vertical lines at each point indicate the standard errors