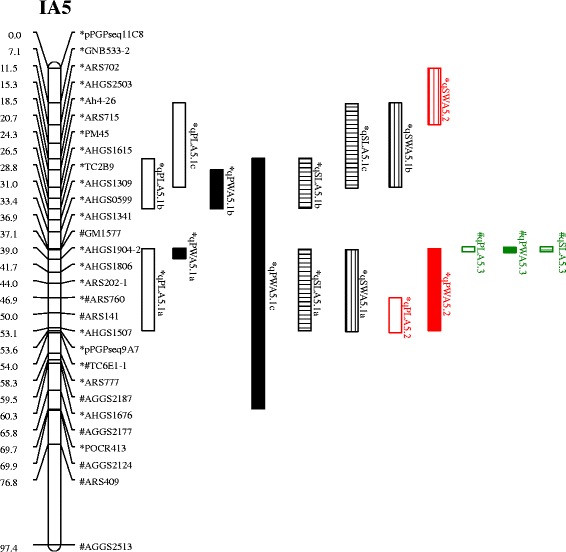
Fig. 2.

Positions of the QTLs on the integrated genetic linkage of FA5 and XA5. Scale bars on the left side describe the map distance in centimorgans. The markers on the linkage group FA5 of the FI population and XA5 of the XZ population were marked with “*” and “#”, respectively. The common markers between the two populations were marked with both “*” and “#”. The QTLs detected in the FI population were marked with “*”, and the QTLs in Wuhan and Yangluo were shown as black and red, respectively. The QTLs detected in the XZ population were marked with “#” and shown as green. The QTLs for pod length, pod width, seed length, and seed width were filled with none, pure colour, horizontal lines and vertical lines, respectively
