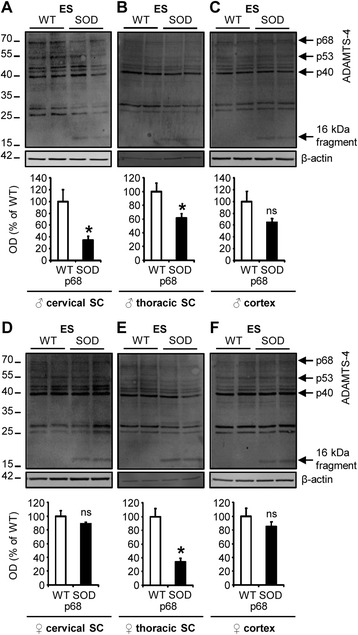
Fig. 3.

Spinal cord-specific decrease of ADAMTS-4 expression in SOD1G93A mice at disease end-stage. a-f Immunoblot for ADAMTS-4 in the cervical or thoracic spinal cord (SC) and in the cortex of WT (blank bar) and SOD1G93A (black bar) male (♂; a, b, c) or female (♀; d, e, f) mice at disease end-stage (ES). Values plotted are mean ± SEM. Mann–Whitney U-tests: * P < 0.05 compared to corresponding WT mice, N = 4
