Fig. 5.

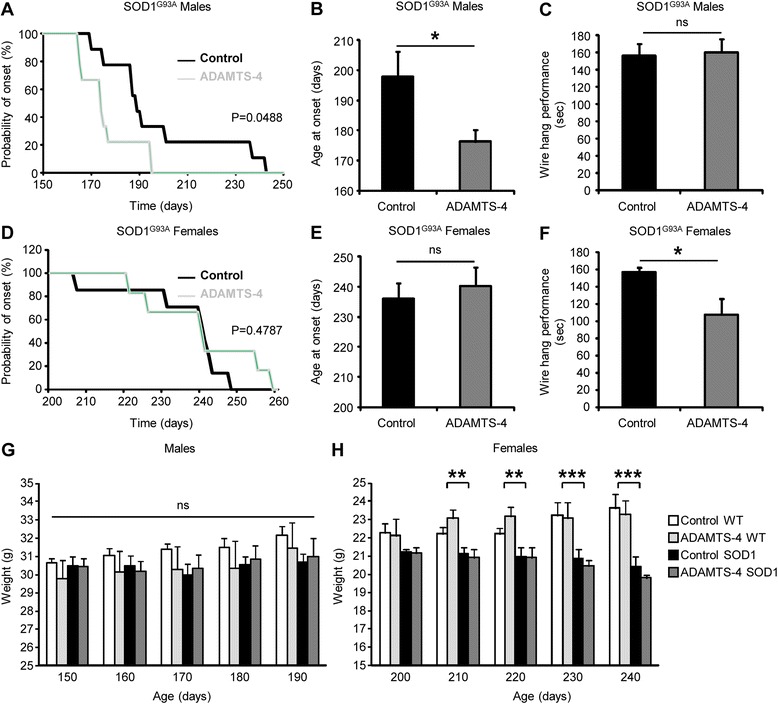
Presymptomatic treatment with rADAMTS-4 worsens the prognosis of SOD1G93A mice. a Kaplan-Meier graph showing the probability of symptom onset in SOD1G93A males treated with saline (Control; black line) or recombinant ADAMTS-4 (ADAMTS-4; gray line) at early presymptomatic stage. Log-rank (Mantel-Cox) Test: * P < 0.05 compared to the control group, N = 9. b Mean age at onset of mice from panel a. Values plotted are mean ± SEM. Mann–Whitney U-test: * P < 0.05 compared to the control group, N = 9. c The best wire hang performance during the first week after symptom onset. Values plotted are mean ± SEM. Mann–Whitney U-test: P > 0.05 compared to the control group, N = 9. d Kaplan-Meier graph showing the probability of symptom onset in SOD1G93A females treated with saline (Control; black line) or recombinant ADAMTS-4 (ADAMTS-4; gray line) during early presymptomatic stage. Log-rank (Mantel-Cox) Test: P > 0.05 compared to the control group, N = 7 Control SOD1G93A, N = 6 ADAMTS-4 SOD1G93A. e Mean age at onset of mice from panel D. Values plotted are mean ± SEM. Mann–Whitney U-test: P > 0.05 compared to the control group, N = 7 Control SOD1G93A, N = 6 ADAMTS-4 SOD1G93A. f The best wire hang performance during the first week after symptom onset. Values plotted are mean ± SEM. Mann–Whitney U-test: * P < 0.05 compared to the control group, N = 7 Control SOD1G93A, N = 6 ADAMTS-4 SOD1G93A. g-h Weight over time of WT and SOD1G93A male (g) or female (h) mice treated or not with saline or recombinant ADAMTS-4 during early presymptomatic stage. Values plotted are mean ± SEM. Two-way Anova: ** P < 0.01, *** P < 0.001 WT Vs SOD1G93A, N = 5 Control WT males, N = 5 ADAMTS-4 WT males, N = 9 Control SOD1G93A males, N = 9 ADAMTS-4 SOD1G93A males, N = 5 Control WT females, N = 4 ADAMTS-4 WT females, N = 7 Control SOD1G93A females, N = 6 ADAMTS-4 SOD1G93A females
