
Fig. 2.
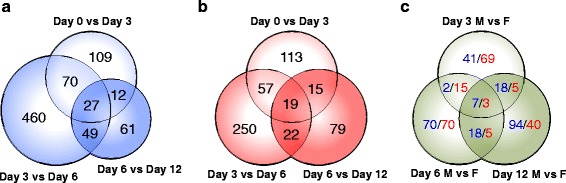
Overlap of development-dependent and sex-dependent differentially expressed genes. Venn diagram of differentially expressed genes (DEGs) in (a) Day 0 to Day 12 MPT (indicated in blue) conditions and (b) Day 0 to Day 12 FPT (indicated in red) conditions based on genome mappings of Tophat. c Venn diagram for number of DEGs between Day 0 to Day 12 MPT and FPT conditions at respective time points, based on genome mapping using Tophat. Number values in blue indicate the number of genes with MPT-biased expression, while values in red indicate the number of genes with FPT-biased expression. All DEGs were determined based on statistical significance (FDR < 0.01) using Cuffdiff software. Further details are available in Additional files 3 and 4