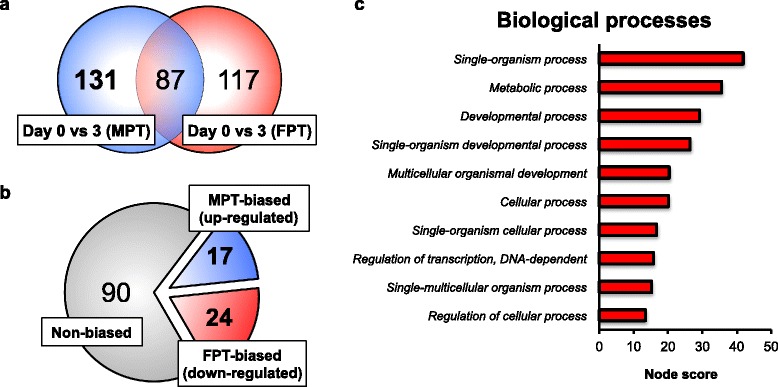
Fig. 3.

Candidate temperature-responsive differential gene expression. a Venn diagrams show the number of DEGs between Day 0 and Day 3 incubated either under MPT (indicated in blue) or FPT (indicated in red). 131 genes (indicated in bold) were found to have MPT-specific gene expression movement, possibly in response to changes in incubation temperature. b 41 out of 131 genes were found to have been up- or down-regulated significantly enough to be sexually dimorphic. 17 genes displayed MPT-biased expression and 24 genes displayed FPT-biased expression. Red, blue, and grey indicate FPT-, MPT- or non-bias, respectively. c Top 10 biological process gene ontology terms mapped to the candidate temperature-responsive genes with highest node score, based on Blast2GO program
