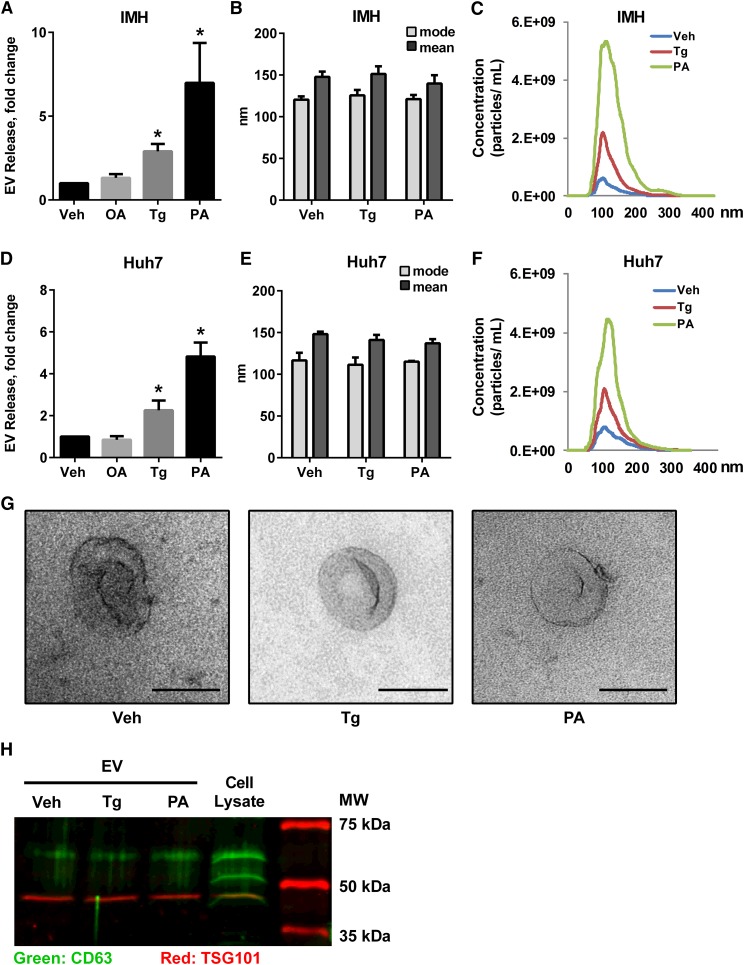
Fig. 1.
PA induces EV release from hepatocytes. IMHs or human hepatoma cells (Huh7) were treated with 2.5 nM Tg, 400 μM OA, 400 μM PA, or vehicle (Veh) for 16 h. Fold increase in EV release (A, D), size distribution (B, E), and concentration and size distribution (C, F) are depicted. G: Morphology of representative EVs by electron microscopy from IMH cells treated as indicated; scale bar equals 100 nm. H: EV makers were confirmed by Western blotting for CD63 and Tsg101. The rightmost lane indicates molecular mass. *P < 0.05 compared with vehicle-treated cells.

