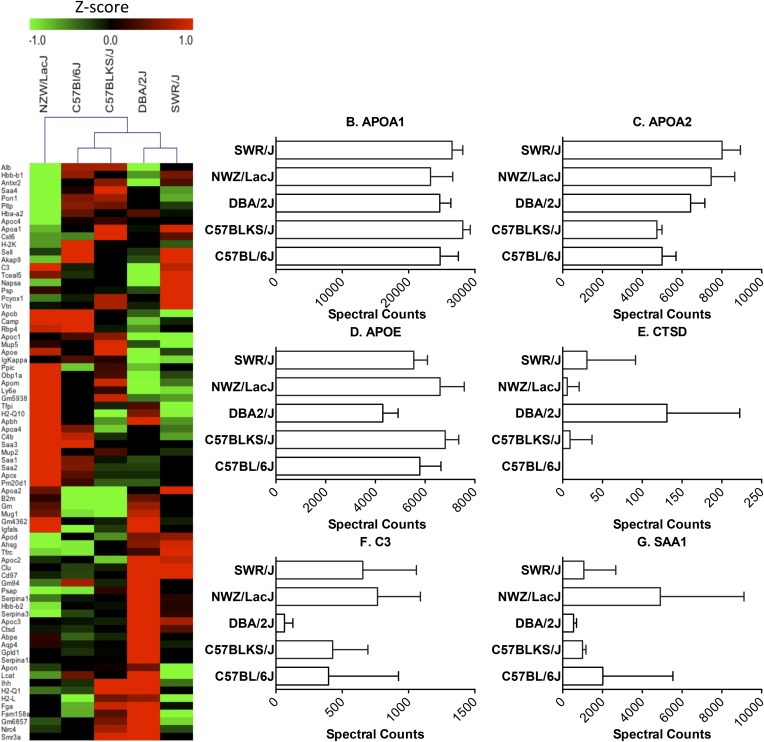
Fig. 1.
The HDL proteome of inbred mouse strains. LC-ESI-MS/MS analysis of proteins in HDL isolated by ultracentrifugation from five different strains of mice. Proteins were quantified by spectral counting (total number of peptides identified for a given protein normalized to total spectral counts). A: Heat map of differentially expressed proteins. Relative protein abundance was calculated as z-scores that were generated from adjusted spectral counts. Red, upregulated; green, downregulated. Mouse strains were clustered by Euclidian hierarchical cluster analysis. B–G: Quantification of representative mouse HDL proteins.

