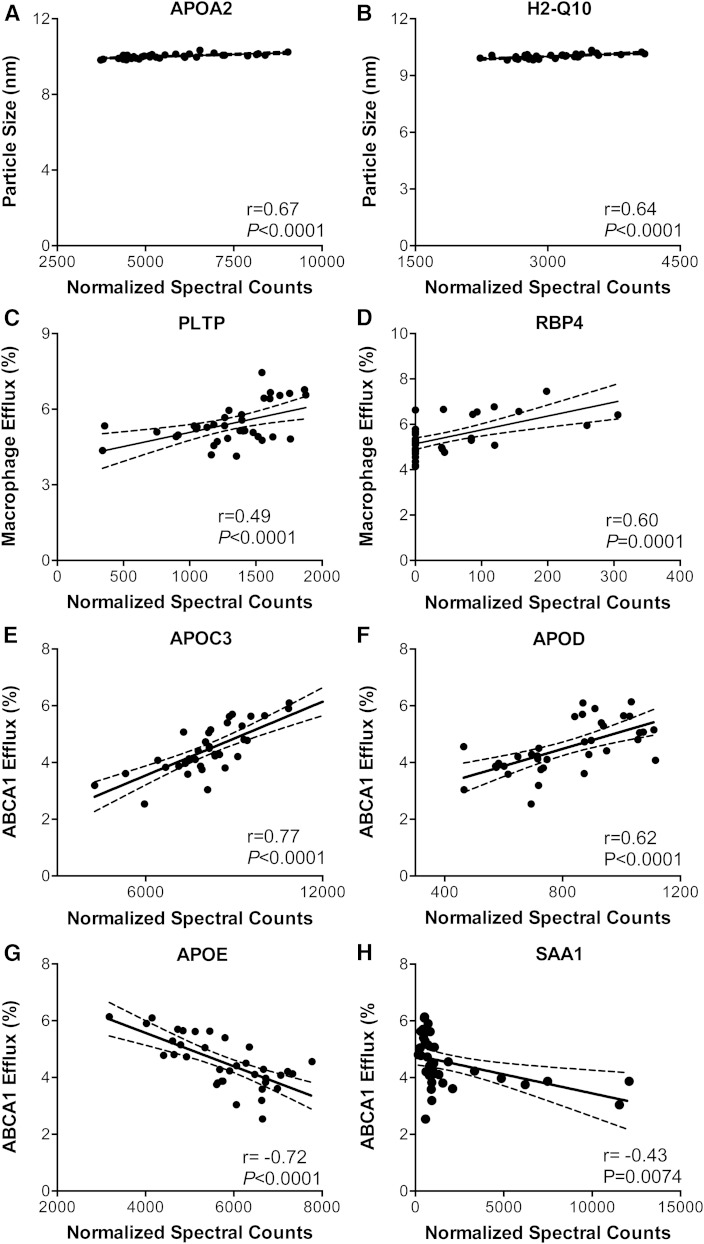
Fig. 4.
Correlations of HDL protein levels with HDL size, macrophage efflux capacity, and ABCA1 efflux capacity. A, B: HDL size was measured by calibrated IMA in HDL isolated from serum by ultracentrifugation. Macrophage cholesterol efflux capacity of serum HDL (C, D) or ABCA1-specific cholesterol efflux capacity (E–H) were measured with serum HDL as described in the legend to Fig. 3. The relationship of relative HDL protein abundance to HDL size and efflux capacity was quantified by Pearson’s correlation. All proteins with r ≥ |0.5| and P < 0.001 were included in this analysis.

