
Figure 2. Functional Characterization of PRKACA Variants.
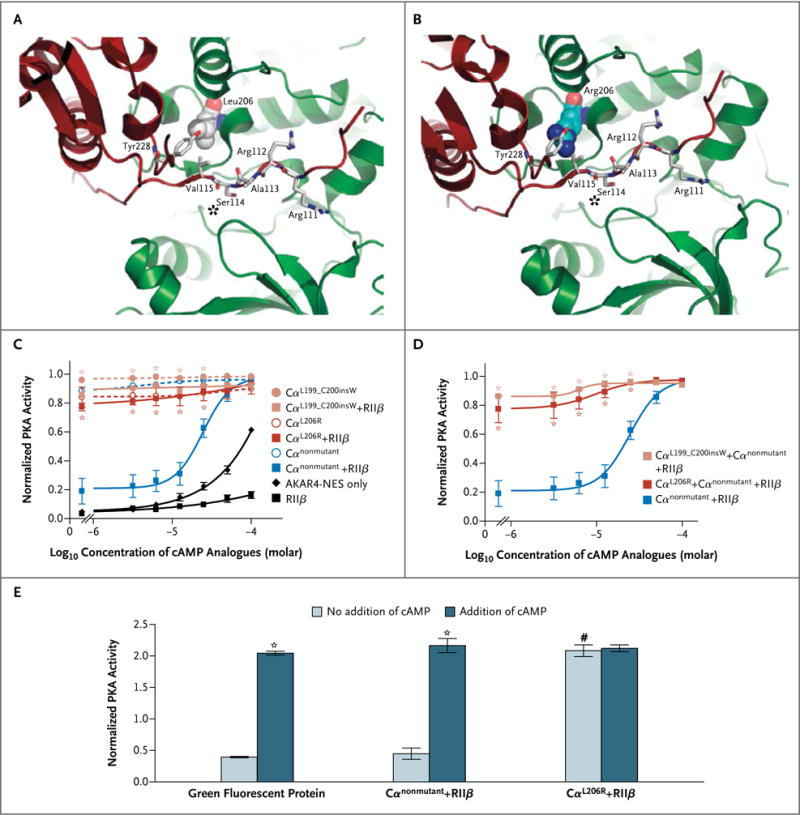
Panel A shows the structure derived from the protein kinase A (PKA) tetramer, with the nonmutant catalytic subunit (Cα) depicted in green and the regulatory subunit (RIIβ) depicted in red. A zoomed view into the region of Leu206 in the Cα subunit is shown. Leu206 is depicted as a space-filling representation; the two residues in close proximity (Val115 and Tyr228) and additional residues from the inhibitory site (Arg111–Ser114, marked with an asterisk) of the regulatory subunit are depicted as sticks. Panel B shows the same region of the PKA tetramer, with Leu206 in the Cα subunit replaced by Arg206, also depicted as a space-filling representation. Panel C shows PKA activity of nonmutant and mutant PKA Cα subunits transfected in human embryonic kidney 293 cells, as determined by means of fluorescence resonance energy transfer (FRET) assay with a PKA reporter (for details, see Fig. S4 in the Supplementary Appendix). The results indicate that the mutant variants are constitutively active. Asterisks indicate P<0.05 for the comparison with Cαnonmutant + RIIβ. AKAR4-NES denotes a protein activity reporter 4 with a nuclear export signal. Panel D shows that high constitutive PKA activity was maintained when either mutant was cotransfected with an equal amount of non-mutant Cα subunit. Asterisks indicate P<0.05 for the comparison with Cαnonmutant + RIIβ. The data in Panels C and D were compared by means of a two-way analysis of variance followed by Bonferroni’s test. Panel E shows the quantification of enzymatic PKA activity; COS-7 cells were transfected with Cα (nonmutant or mutant) and RIIβ, with or without the addition of cyclic AMP (cAMP). Asterisks indicate P<0.05 for the comparison between samples with and those without the addition of cAMP. The hatch mark indicates P<0.05 for the comparison between samples transfected with nonmutant Cα subunit and those transfected with mutant Cα subunit without the addition of cAMP. In Panels C, D, and E, the I bars represent the standard error.