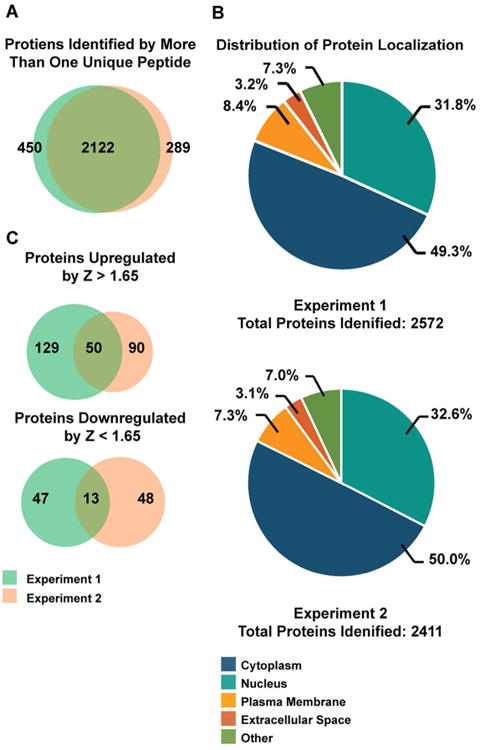
Figure 2.

Distributions of proteins identified from two independent SILAC experiments. (A) Venn diagrams of total proteins identified from the two experiments using the opposite differential labeling protocols. (B) Sub-cellular localizations of total proteins identified were determined using the Ingenuity Pathway Analysis program. (C) Total number of proteins that are up-regulated (Z-score >1.65) or down-regulated (Z-score < -1.65) in the infected samples from the two labeling experiments.
