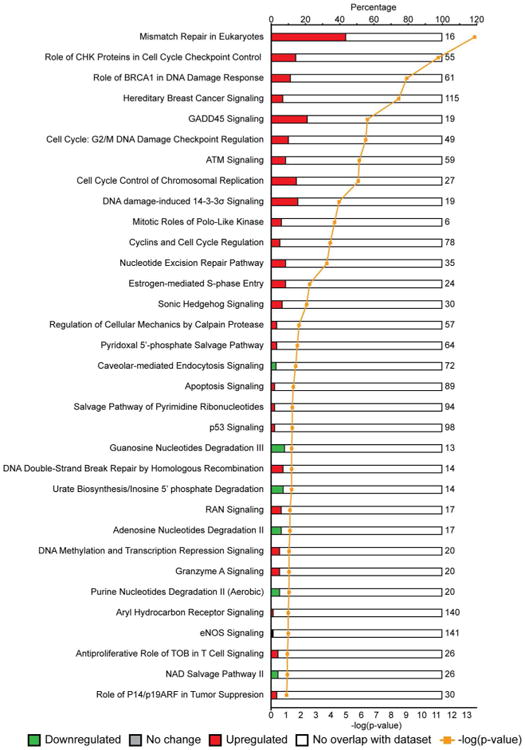
Figure 4.

Canonical pathway analysis of differentially regulated proteins. Top canonical pathways identified by Ingenuity Pathway Analysis (IPA) of the significantly up and down regulated proteins recovered in both experiments are listed. The red and green bars represent proteins up- and down-regulated respectively as a percent (top x-axis) of the total proteins present in that pathway (to the right of the empty bars, determined by IPA). P-value is defined as the likelihood of each ratio occurring due to random chance and the gold line displays the -log(p-value) (bottom x-axis). Therefore the greater the -log(p-value) is, the more significant the pathway is represented in the SILAC datasets.
