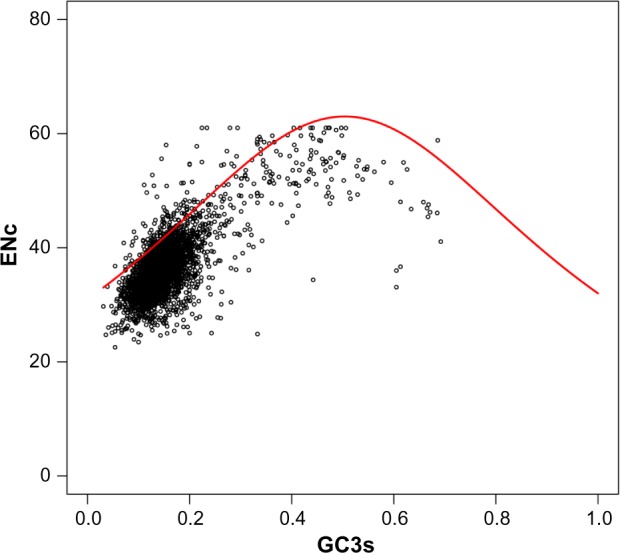
Figure 5.

ENc of each CDS plotted against GC3s. ENc shows the effective number of codons, and GC3s shows the GC content on the synonymously variable third position of the sense codon. The red points denote total CDSs; the red solid line represents the expected ENc.
