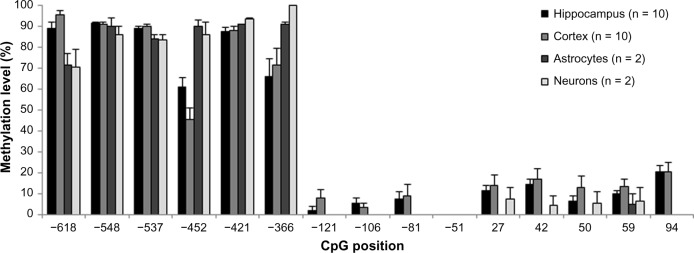
Figure 3.
DNA methylation analysis revealed a stretch of unmethylated CpG dinucleotides in the proximal t-PA promoter, whereas more upstream CpGs were highly methylated. DNA methylation levels (%) are shown for human hippocampal tissue (n = 10), human cortical brain tissue (n = 10), cultured human astrocytes (n = 2), and cultured human neurons (n = 2). Results are presented as mean ± SEM.

