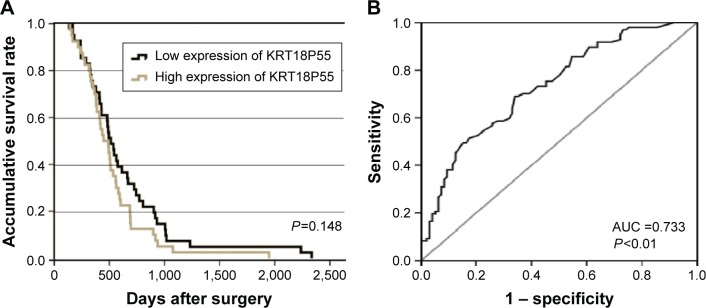
Figure 3.
(A) Overall survival of patients from TCGA datasets (P=0.148). (B) ROC curve of patients based on KRT18P55 expression in GC tissue samples and matched NATs.
Abbreviations: AUC, area under the ROC curve; GC, gastric cancer; NATs, normal adjacent tissues; ROC, receiver operating characteristic; TCGA, The Cancer Genome Atlas.

