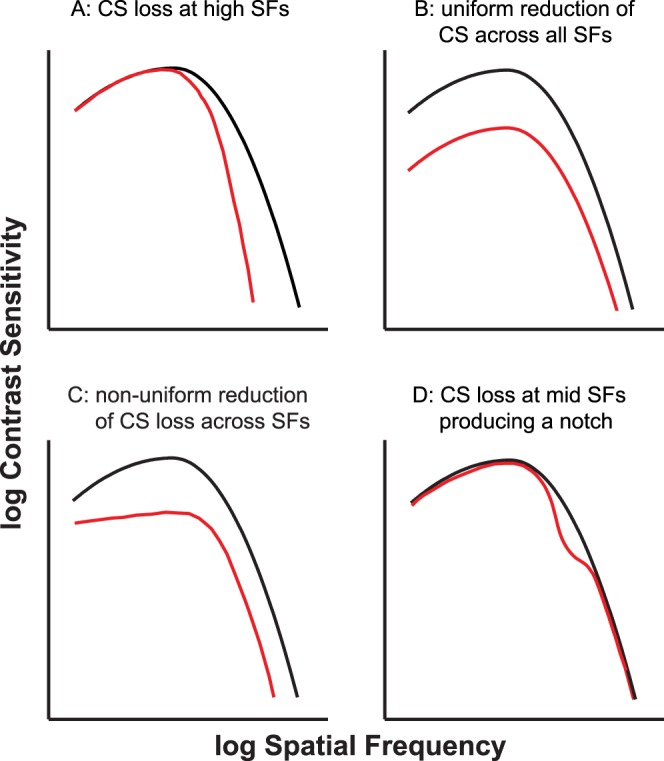
Figure 1.

Schematic figure depicting four possibilities for the shape of a low-vision CSF (plotted in red). The black curve in each panel represents the normal-vision CSF. (A) A low-vision CSF that exhibits contrast sensitivity loss only at high spatial frequencies. (B) Uniform CS reduction across all spatial frequencies, resulting in a vertical shift of the normal CSF. (C) An example of a CSF when the CS reduction is not uniform across all spatial frequencies. (D) Contrast sensitivity loss only in the midfrequency range, resulting in a “notch.” This kind of CSF has been reported for patients with neurologic disorders.
