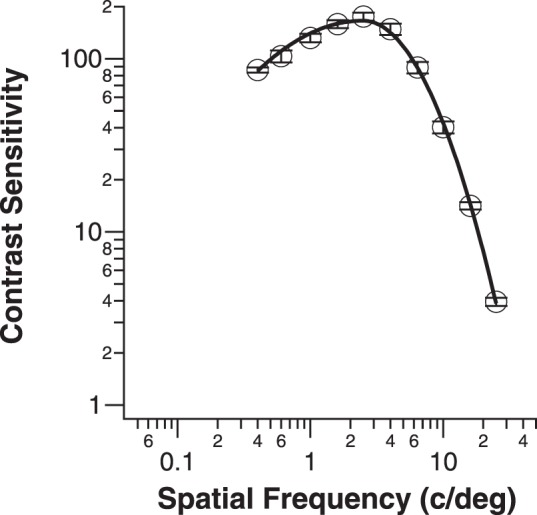
Figure 2.

Contrast sensitivity is plotted as a function of spatial frequency (c/deg) for the five normal-vision control observers. Each data point represents the sensitivity (reciprocal of contrast threshold) based on eight reversals per staircase, four staircases per observer, and five observers. Error bars represent the SD of the mean sensitivity based on 1000 bootstrap resamplings.
