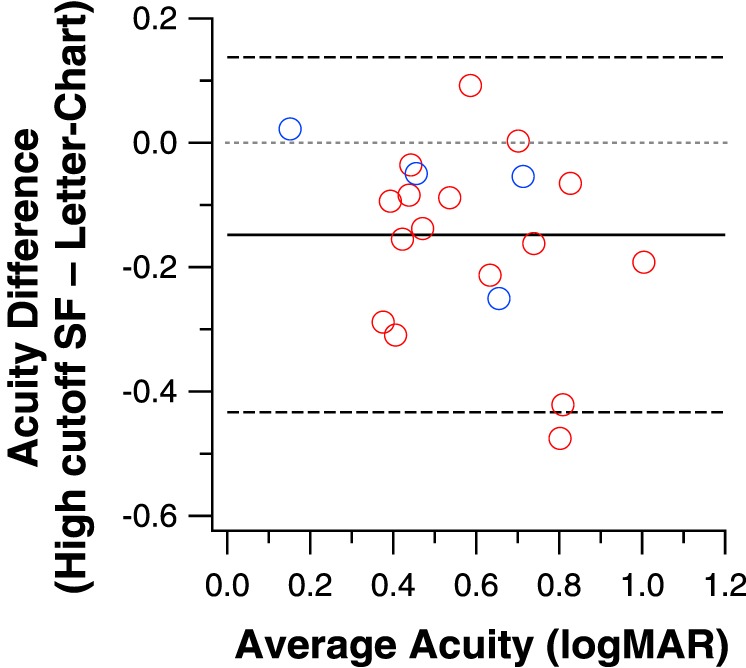
Figure 7.

Letter-chart acuity and the high cutoff spatial frequency derived from the free-fit method (converted to logMAR acuity) are compared in a Bland-Altman plot. The mean difference between the two methods is 0.15 logMAR (black solid line) and is statistically different from 0 (gray dotted line).
