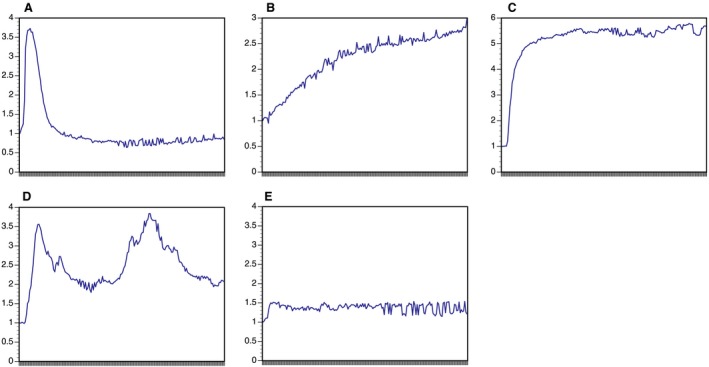
Figure 4.

Kinetic response patterns of parathyroid cells after calcium stimulus. Mean fluorescence intensity (MFI) is shown on the y‐axis; observation time (10 min. total) is shown on the x‐axis. (A) Rapid/transient response. (B) Slowly rising response. (C) Maximal response. (D) Multiple peak response. (E) Non‐responsive.
