Figure 5.

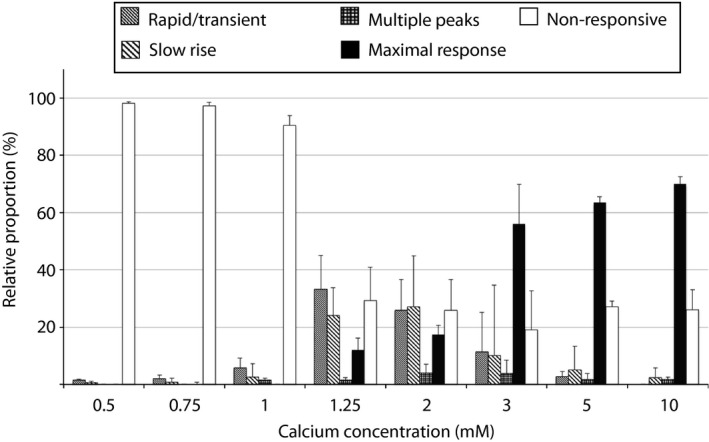
Proportional distribution of cells in five kinetic response categories at different calcium concentrations. Bars indicate mean proportion ± S.D. from 11 adenoma samples.

Proportional distribution of cells in five kinetic response categories at different calcium concentrations. Bars indicate mean proportion ± S.D. from 11 adenoma samples.