
Figure 4.
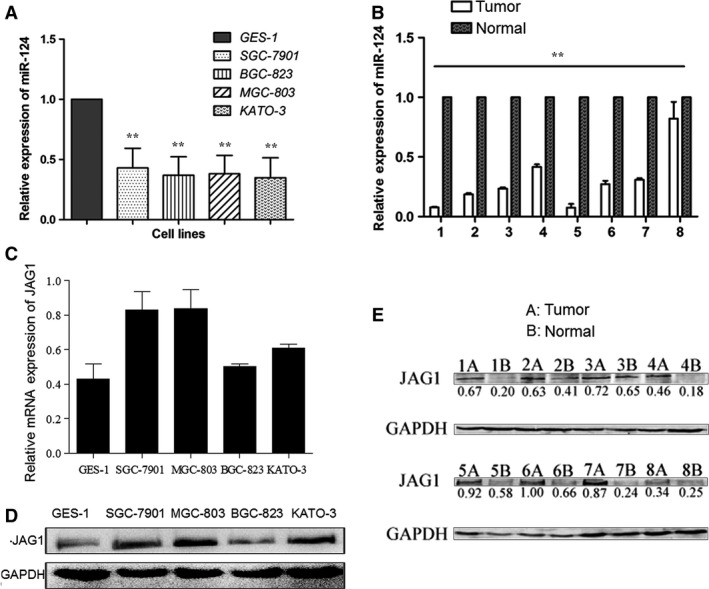
Negative correlation between miR‐124 and JAG1 expression in clinical specimens and cell lines. (A) The levels of miR‐124 expression were determined in human gastric epithelial immortalized GES‐1 cell line and GC cell lines (SGC‐7901, BGC‐823, MGC‐803, KATO‐3) using qRT‐PCR. The relative miR‐124 expression in gastric cancer cell lines was much lower than that of GES‐1. One‐way anova test was conducted. (B) The levels of miR‐124 expression were determined in eight cases of fresh GC tissues and paired adjacent non‐tumour tissues using qRT‐PCR. Independent samples t‐test was used to analyse the difference between two groups. (C) The levels of JAG1 mRNA expression were determined in GES‐1, SGC‐7901, BGC‐823, MGC‐803 and KATO‐3 cells using qRT‐PCR. (D) Western blot analyses of JAG1 protein levels in GES‐1 and four cancer cell lines. (E) Western blot analyses of JAG1 protein levels in GC tissues and paired adjacent non‐tumour tissues. Densitometric quantification of JAG1 band intensities were normalized to GAPDH, ratios are shown under the bands. Expression of miR‐124 and JAG1 exhibited a significant inverse correlation calculated by Pearson's correlation (r = −0.67, P < 0.05). **P < 0.01.