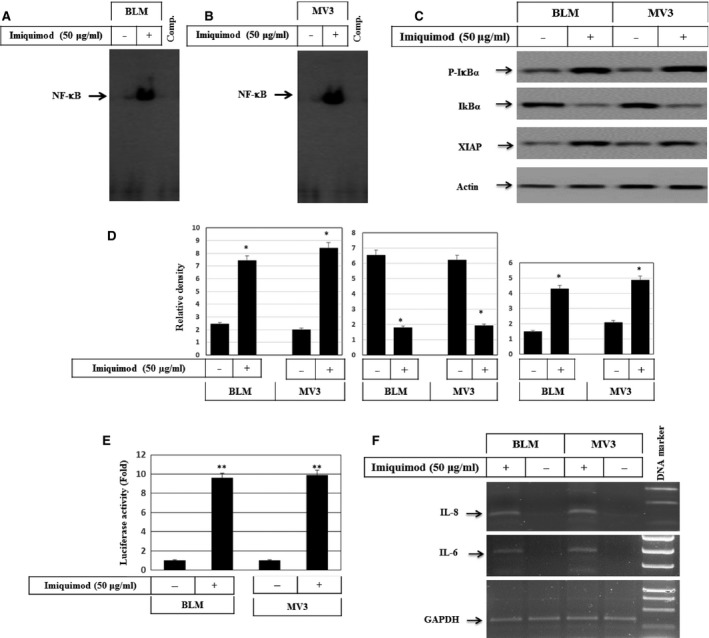
Figure 4.

(A) Western blot analysis demonstrates the phosphorylation of IκBα and its subsequent degradation and the induction of XIAP in response to the treatment of melanoma cells with imiquimod for 48 hrs. Actin was used as an internal control for loading and transfer. EMSA demonstrates the activation of the nuclear transcription factor NF‐κB in BLM (B) and MV3(C) melanoma cells in response to the treatment with imiquimod. Data are representative of three independent experiments yielding similar results. (D) Analyses of band intensity on films are presented as the relative ratio of phospho‐IκBα, and expression of IκBα, XIAP to actin. Bars represent mean ± SD from three blots. *P < 0.05 versus control. (E) Luciferase reporter assay demonstrates imiquimod‐induced activation of NF‐κB in both melanoma cell lines, BLM and MV3. Data represented as mean ± SD of three independent experiments. **P < 0.01, significantly different when compared with control cells. (F) RT‐PCR demonstrates the induction of both IL‐6 and IL‐8 expression, the target genes of NF‐kB in response to the treatment of both BLM and MV3 cells with imiquimod. Data are representative of three independent experiments.
