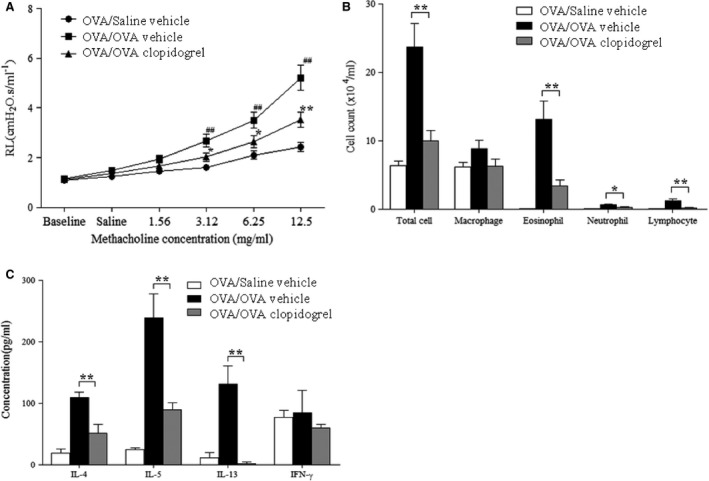
Figure 2.

The effect of clopidogrel treatment on airway responses in an OVA‐specific asthma model. (A) Changes in lung resistance by increasing methacholine 0, 1.56, 3.12, 6.25 and 12.5 mg/kg were assessed 48 hrs after the final challenge. (B) Cell composition in BAL fluid. (C) The levels of IL‐4, IL‐5, IL‐13 and IFN‐γ were determined by using ELISA in BAL fluid. OVA/Saline vehicle, mice sensitized with OVA and challenged with saline; OVA/OVA vehicle, mice sensitized and challenged with OVA; OVA/OVA clopidogrel treatment, OVA challenged mice treated with clopidogrel. The data are expressed as the mean ± SEM. n = 15 for each group. **P < 0.01 and *P < 0.05 versus the OVA/OVA vehicle group. ##P <0 .01 versus the OVA/saline vehicle group. RL, resistance of lung; OVA, ovalbumin; IL, interleukin; IFN, interferon.
